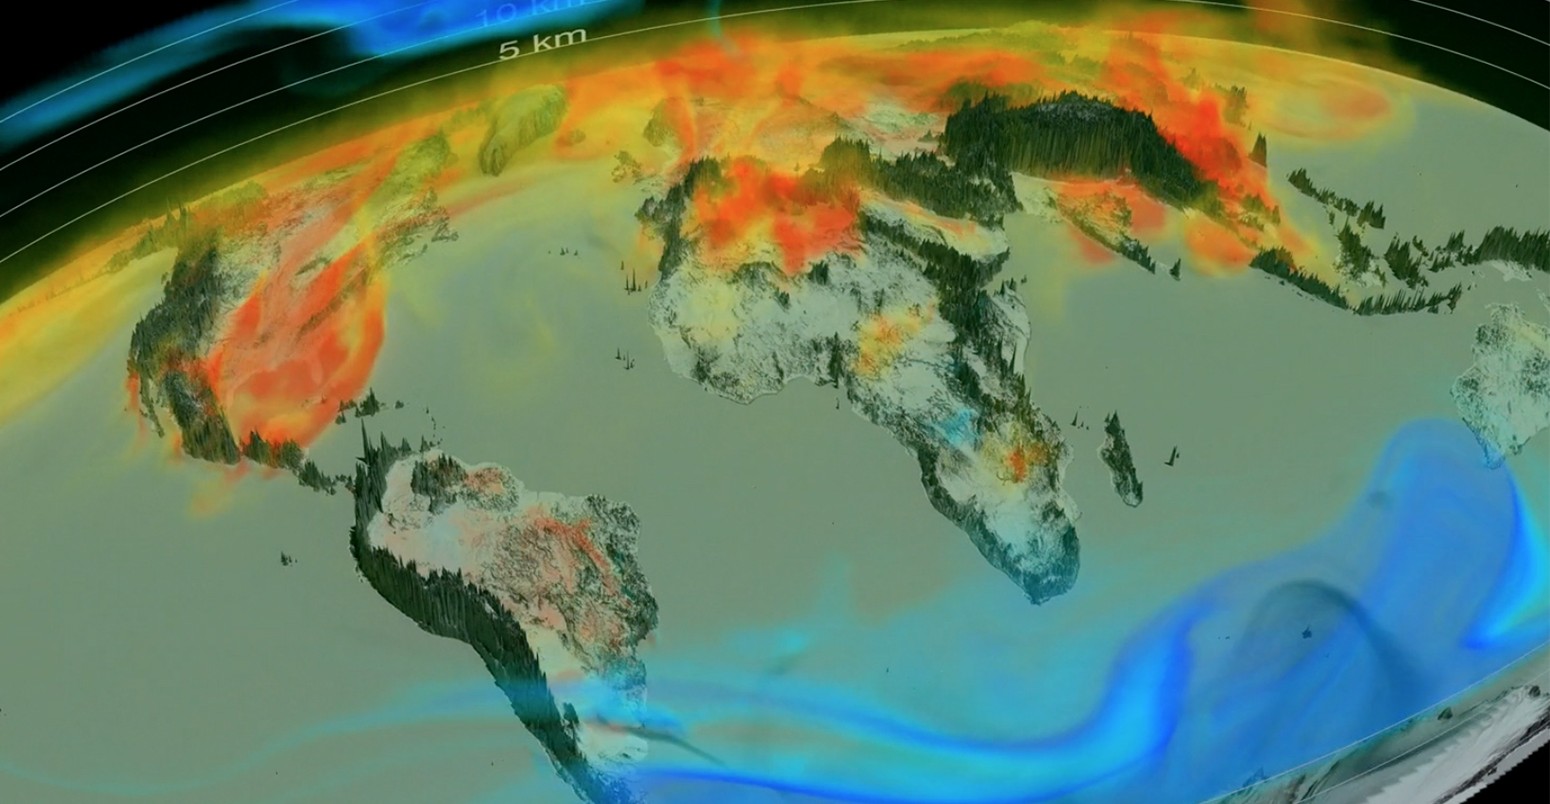
NASA has taken a groundbreaking step in climate science by producing the first-ever three-dimensional (3D) animation of global carbon emissions. This advanced visualization provides scientists, policymakers, and the public with a new perspective on how carbon dioxide (CO₂)—the primary greenhouse gas driving climate change—moves through the Earth’s atmosphere. For decades, researchers have monitored global carbon concentrations using satellites, ground-based sensors, and climate models, but this new 3D animation allows viewers to see carbon flow across the globe in real time, making the invisible visible in unprecedented detail.
This animation is part of NASA’s ongoing commitment to climate research and public engagement. It uses data collected from multiple satellites, including the Orbiting Carbon Observatory-2 (OCO-2) and OCO-3, to create a dynamic, three-dimensional view of CO₂ levels. By presenting this information in a visually intuitive format, NASA aims to improve understanding of how human activities, seasonal cycles, and natural processes contribute to carbon emissions worldwide.
The Importance of Visualizing Carbon in 3D
Understanding how carbon moves through the atmosphere is crucial for several reasons:
1. Climate Science
Carbon dioxide is the largest contributor to anthropogenic climate change. Scientists need accurate data to:
-
Model global warming trends
-
Predict regional climate impacts
-
Assess carbon sinks such as forests and oceans
2. Policy and Decision-Making
Policymakers require reliable visuals to support climate legislation. Seeing CO₂ emissions in 3D helps demonstrate the scale and movement of carbon, making it easier to communicate with stakeholders and the public.
3. Public Engagement
Traditional graphs and charts can fail to convey the urgency of climate change. A 3D animation is far more compelling, showing carbon emissions swirling across continents and oceans, helping people understand the global nature of the crisis.
How NASA Created the 3D Animation
The animation is the result of years of research, combining satellite measurements with advanced modeling techniques. Key components include:
1. Data Collection
NASA relies on its fleet of Earth-observing satellites:
-
OCO-2: Measures CO₂ from orbit with high precision.
-
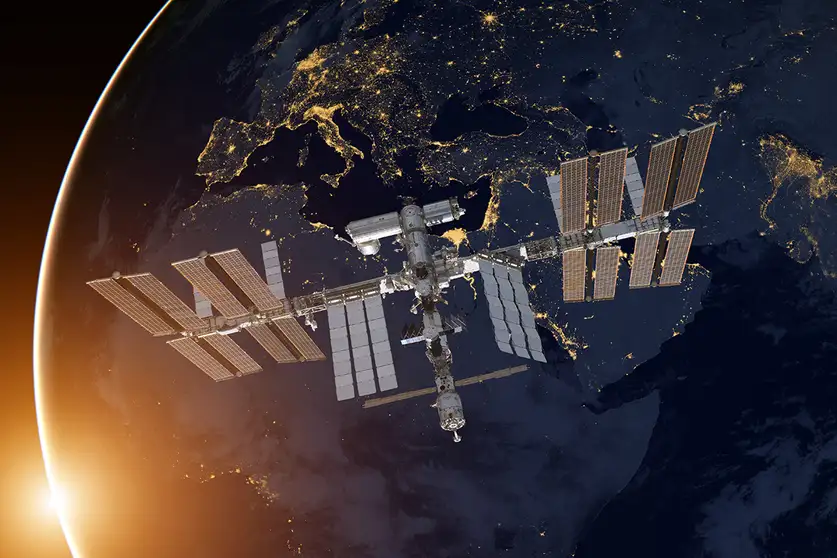
OCO-3: Mounted on the ISS, tracks CO₂ from different angles and provides near real-time data.
-
Other satellites: Including instruments that measure land and ocean carbon fluxes.
These satellites provide global coverage and capture variations due to industrial activity, vegetation cycles, and natural processes.
2. 3D Atmospheric Modeling
NASA scientists use sophisticated climate and atmospheric models to simulate how carbon moves through the atmosphere. These models take into account:
-
Wind patterns
-
Seasonal changes
-
Temperature variations
-
Ocean-atmosphere interactions
The result is a dynamic representation that shows CO₂ concentration in three dimensions, from the Earth’s surface up through the atmosphere.
3. Visualization Technology
Using high-performance computing, NASA converts raw data into a visually intuitive format. The 3D animation shows:
-
Areas of high emissions, such as cities and industrial regions
-
Seasonal shifts in carbon absorption and release
-
Transcontinental movement of CO₂ across hemispheres
This visualization makes it easier to understand the complex interactions driving the carbon cycle.
Key Insights From the Animation
NASA’s 3D animation provides insights into how human and natural factors contribute to carbon emissions:
1. Human-Caused Emissions
Urban areas and industrial regions stand out clearly. Cities in North America, Europe, China, and India appear as “hotspots” where CO₂ concentrations are significantly higher.
2. Seasonal Variations
Forests and vegetation act as natural carbon sinks. During the Northern Hemisphere’s summer, plants absorb more CO₂, temporarily lowering atmospheric levels. The animation shows these seasonal “breathing cycles” across continents.
3. Atmospheric Transport
Carbon emissions do not stay localized. The animation demonstrates how wind and atmospheric circulation transport CO₂ across oceans and continents, highlighting the global connectivity of carbon emissions.
4. Ocean Interactions
The 3D model also shows how oceans absorb carbon dioxide. Regions of high ocean uptake, such as the North Atlantic, are visible as areas where atmospheric CO₂ concentration is reduced.
Applications for Climate Science
NASA’s animation is more than a public engagement tool—it has real scientific applications:
1. Tracking Emission Sources
By identifying emission hotspots, scientists can target mitigation efforts more effectively. Policymakers can use this data to implement carbon-reduction policies and monitor compliance.
2. Understanding Carbon Sinks
The 3D visualization helps scientists study how forests, grasslands, and oceans absorb carbon. This knowledge is critical for climate modeling and predicting future warming.
3. Climate Model Validation
The animation allows researchers to compare real-world data with climate models, improving accuracy. Differences between observed and predicted CO₂ movement can reveal gaps in our understanding of atmospheric processes.
4. Education and Outreach
Visualizing carbon in 3D engages students, educators, and the general public, making the impacts of climate change easier to understand.
Global Carbon Emissions Trends
NASA’s research underscores several key trends:
-
Rising CO₂ Levels: Despite global mitigation efforts, atmospheric CO₂ continues to rise due to fossil fuel burning, deforestation, and industrial activities.
-
Human Activity as a Primary Driver: Emissions from cities, factories, and transportation dominate the global carbon footprint.
-
Natural Variability: Seasonal vegetation cycles, volcanic activity, and ocean absorption create temporary fluctuations in atmospheric CO₂.
-
Interconnected Atmosphere: Carbon does not respect borders; emissions in one region affect the entire planet.
The 3D animation allows these trends to be observed in motion, making the dynamics of Earth’s carbon cycle clearer than ever.
Technological Challenges and Achievements
Creating a 3D animation of global carbon emissions is technically challenging:
-
High-resolution satellite data must be processed in near real-time.
-
Atmospheric models require immense computational power.
-
Data from multiple sources must be integrated accurately.
-
Visualization tools must render complex, dynamic information in an intuitive format.
NASA’s success demonstrates the agency’s leadership in Earth observation, climate modeling, and data visualization, showcasing how space technology can directly inform environmental policy and public understanding.
The Role of NASA Satellites in Climate Monitoring
Satellites are crucial for tracking global carbon emissions because ground-based measurements alone are insufficient. They offer:
-
Global coverage: Satellites can observe remote regions, oceans, and polar areas.
-
Consistency: Satellite instruments provide standardized, repeatable measurements.
-
Long-term monitoring: Decades of satellite data allow scientists to track trends over time.
OCO-2 and OCO-3, in particular, have revolutionized carbon monitoring, offering precise measurements of CO₂ levels with high spatial resolution.
NASA’s Commitment to Public Awareness
Beyond scientific research, NASA emphasizes public education. The 3D animation is designed to:
-
Demonstrate the urgency of climate change
-
Encourage individuals to reduce carbon footprints
-
Inspire policymakers to implement evidence-based strategies
-
Support global climate initiatives
By visualizing emissions dynamically, NASA helps bridge the gap between complex scientific data and public understanding.
Global Collaboration in Carbon Monitoring
NASA is not working alone. The agency collaborates with international partners, including:
-
The European Space Agency (ESA)
-
Japanese Aerospace Exploration Agency (JAXA)
-
Canadian Space Agency (CSA)
-
University and research networks worldwide
This collaborative approach ensures that carbon monitoring is comprehensive, accurate, and globally relevant.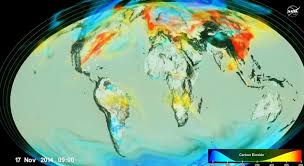
Future Directions: Expanding the 3D Carbon Map
NASA plans to expand the 3D animation project by:
-
Incorporating additional greenhouse gases, such as methane (CH₄)
-
Extending observations to oceans and soil carbon fluxes
-
Enhancing real-time visualization for immediate public access
-
Integrating with AI and machine learning to predict future emissions trends
These improvements will provide policymakers and scientists with even more powerful tools for combating climate change.
Conclusion
NASA’s first 3D animation of global carbon emissions represents a major breakthrough in climate science and communication. By making invisible carbon flows visible, this project offers:
-
Scientific insights into atmospheric dynamics
-
Practical applications for emission tracking and policy-making
-
Public engagement that educates and inspires action
As humanity faces the urgent challenge of climate change, tools like this 3D visualization are essential. They provide clarity, improve decision-making, and remind the world that carbon emissions are a global problem requiring global solutions.
With continued satellite observations, advanced modeling, and innovative visualizations, NASA is helping humanity understand and address the critical challenge of our time: protecting Earth’s climate for future generations.
Read Also: Keep your face towards the sunshine and shadows will fall behind you
Watch Also: https://www.youtube.com/@TravelsofTheWorld24


Leave a Reply